
This is a mini Tableau data story about the denim industry. The apparel industry is one of the biggest contributors to global climate change, with denim being one of the most polluting sub-industries. It takes around 7,500 liters of water to make a single pair of denim jeans which produces 44 pounds of CO2, roughly equal to the greenhouse gas emissions from driving a passenger car for nearly 50 miles.
Dirty Denim
Data Storytelling
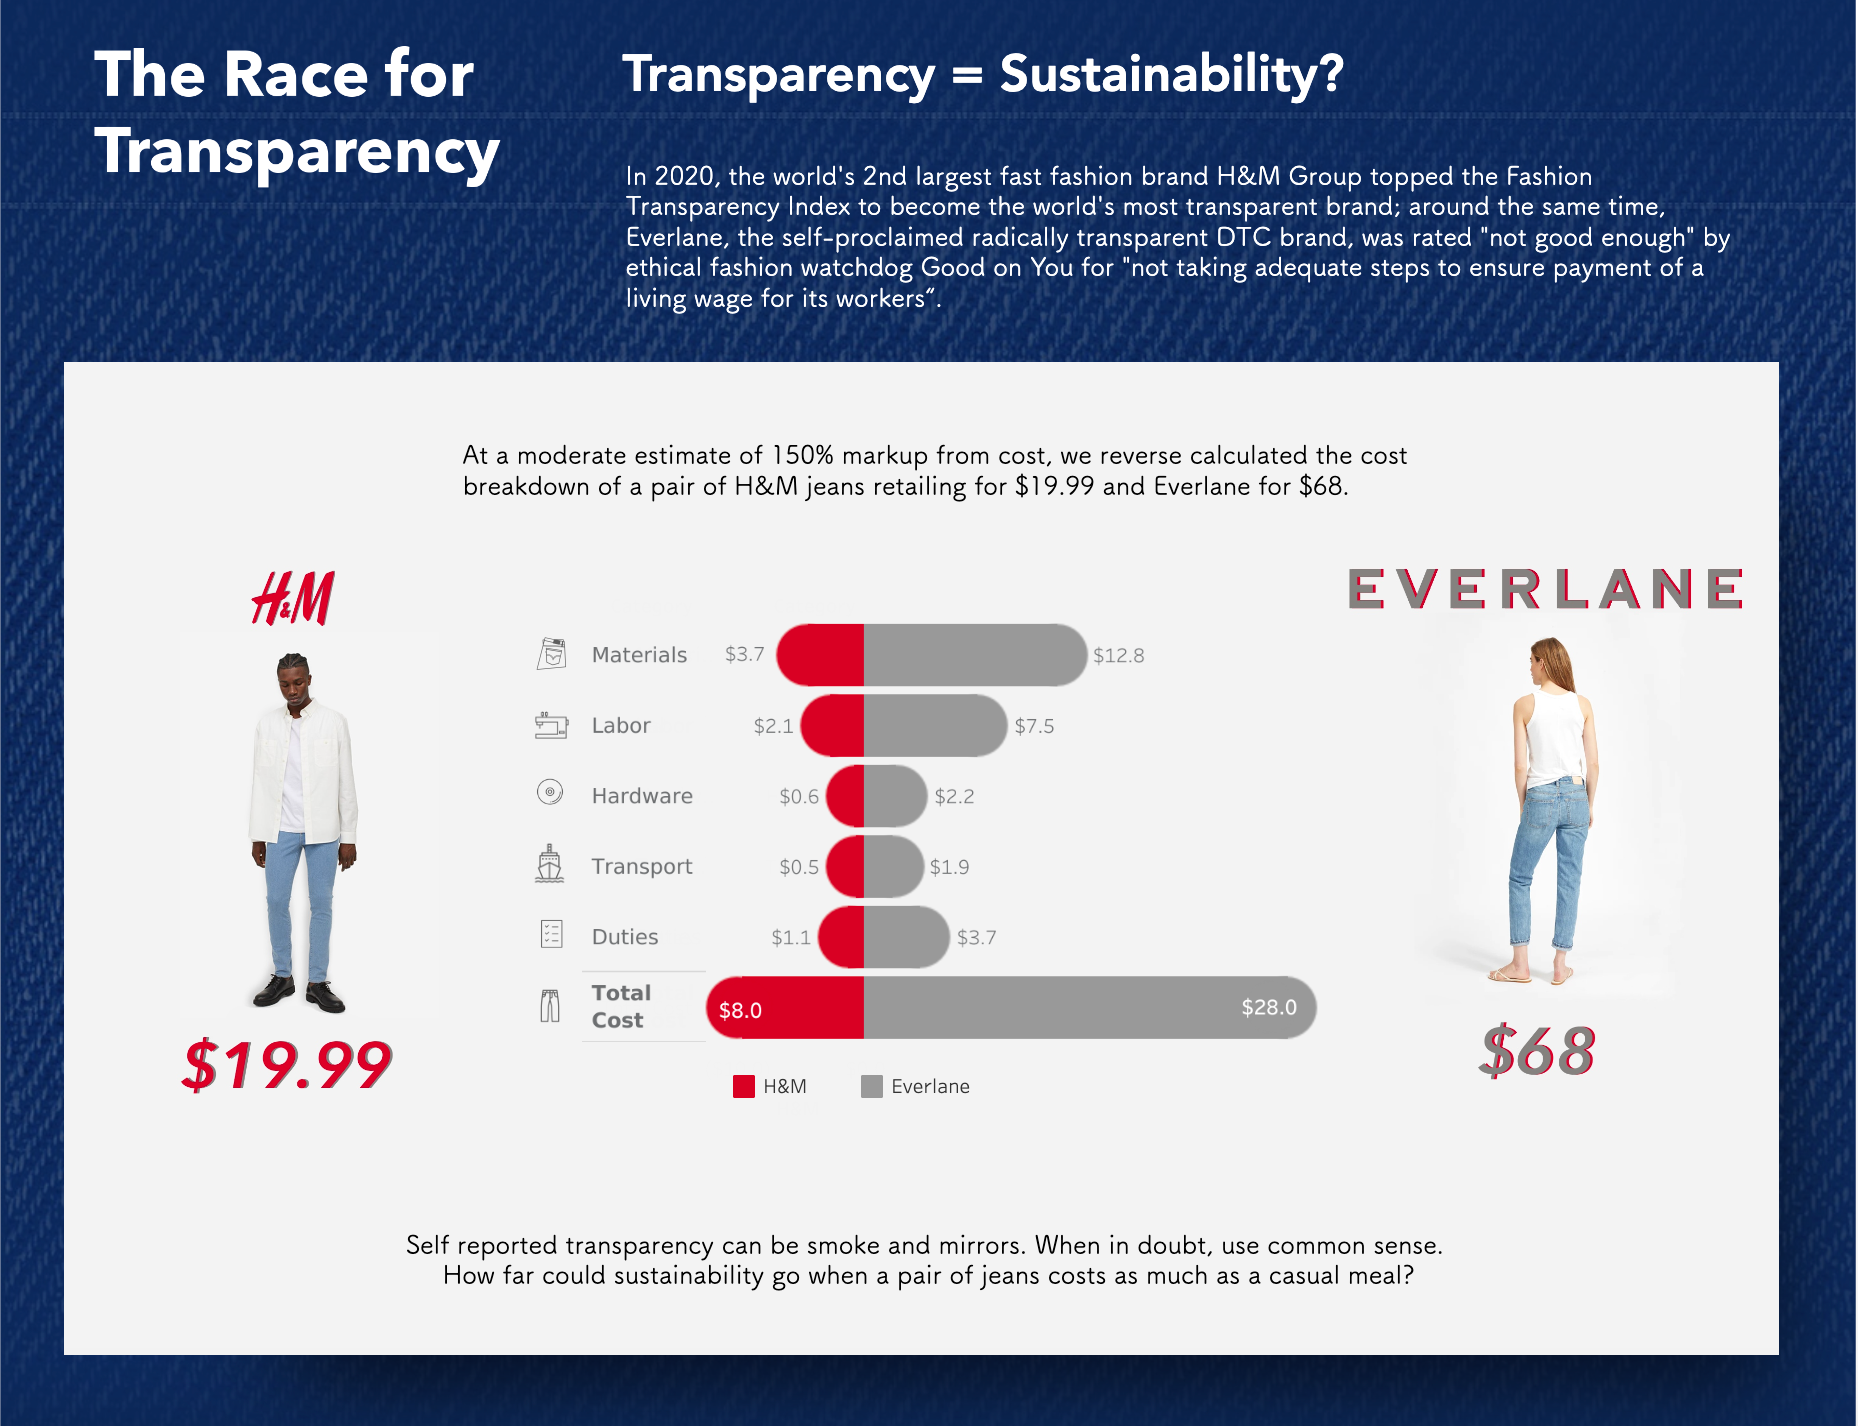
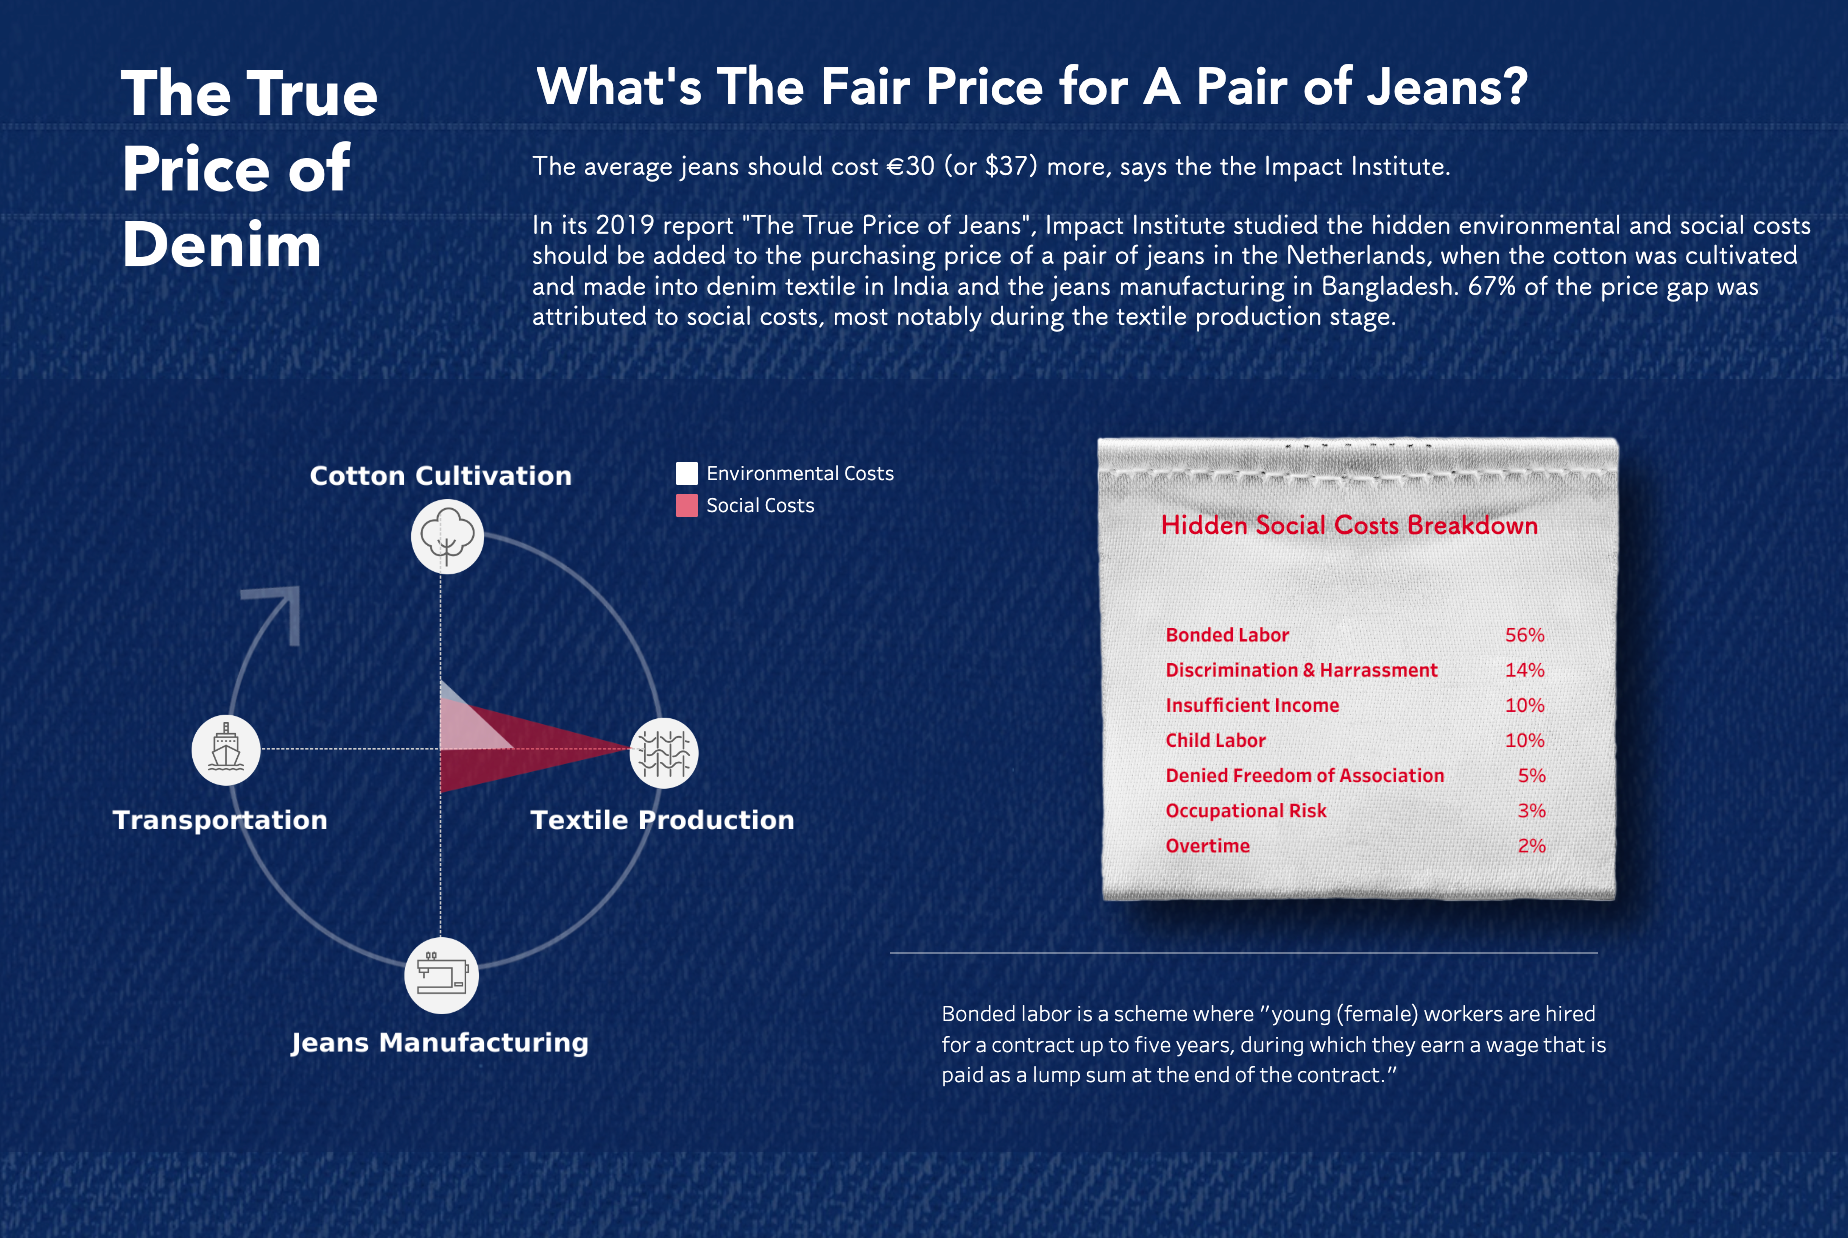
In this data story, I touched upon pricing, costing, wage, and hidden social costs of the denim industry and called upon awareness that the price at which we are used to pay for a pair of jeans is baked into a system of exploitations and someone else is paying the hidden social cost for the low price denim we are consuming.
Charts I built:
- Ridged line chart
- Dual sided bar chart
- Polar radial chart