This is a SQL and Tableau project exploring a 98k user dataset of a French C2C fashion resale platform. I first ran some SQL queries to get a general sense of the data and decided to focus on overall user engagement and in-depth analysis of buying and selling behaviors.
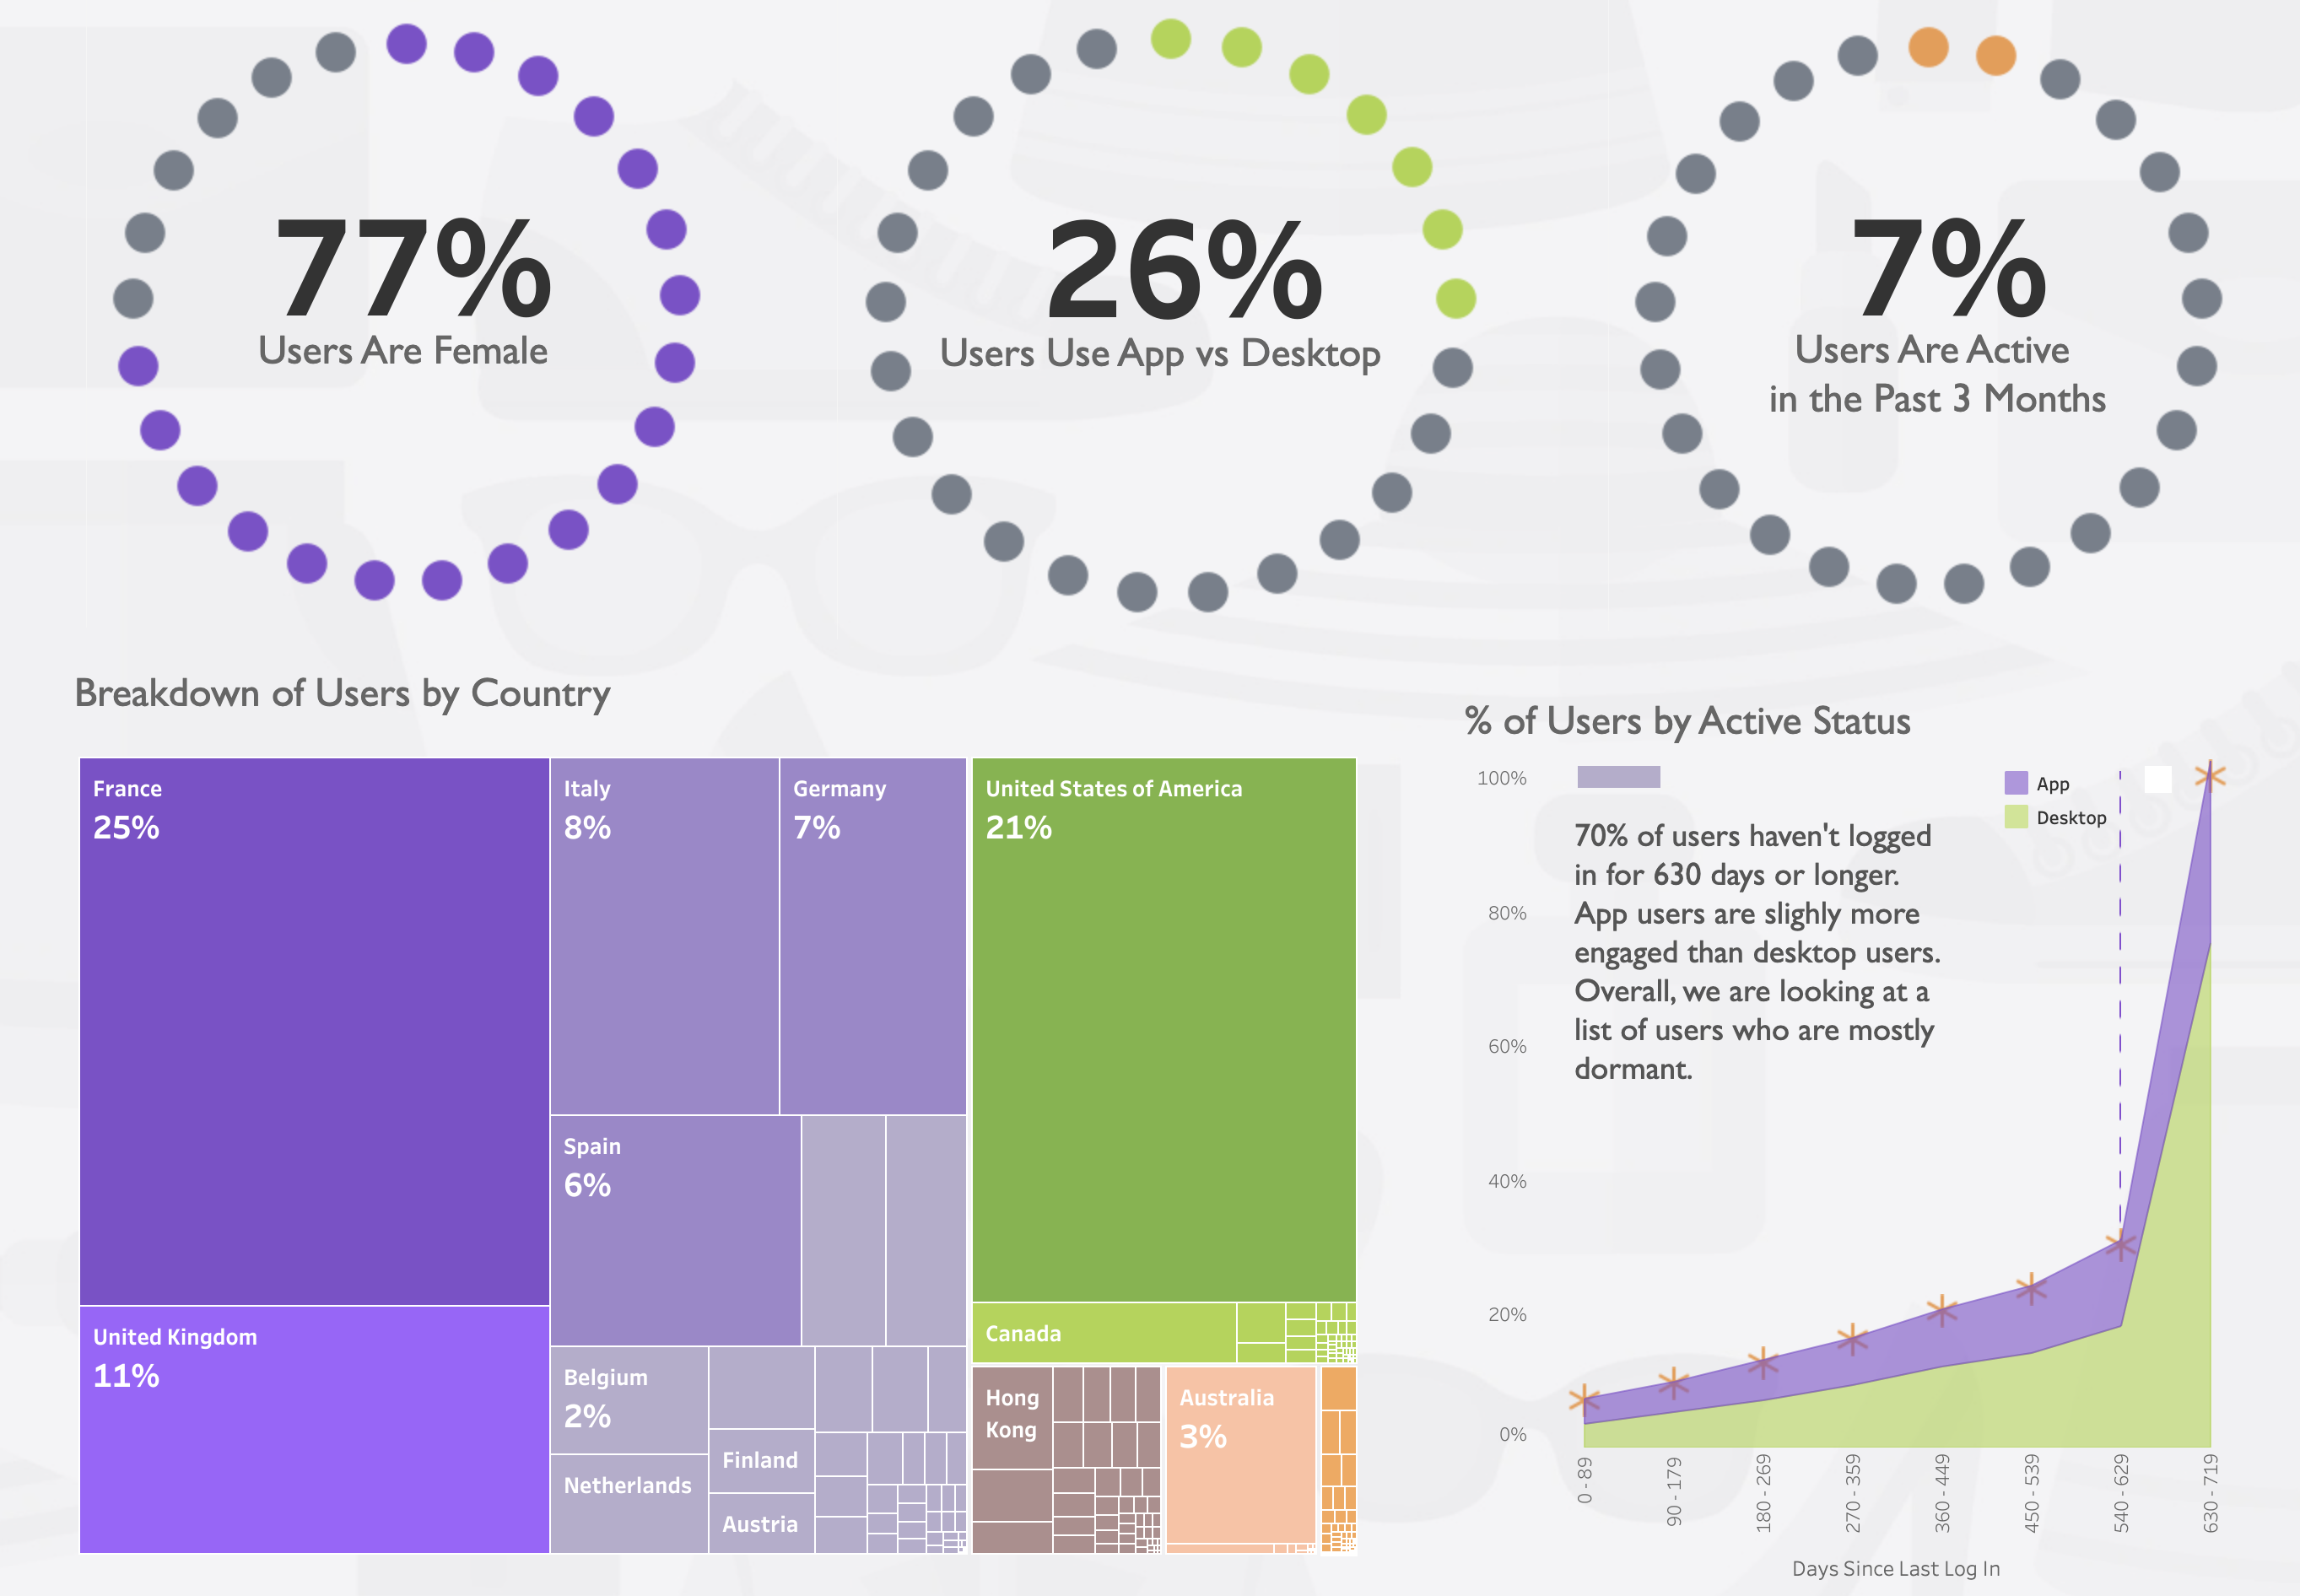
The exploratory data analysis revealed that I was dealing with a list of users who are mostly inactive and low engagement.
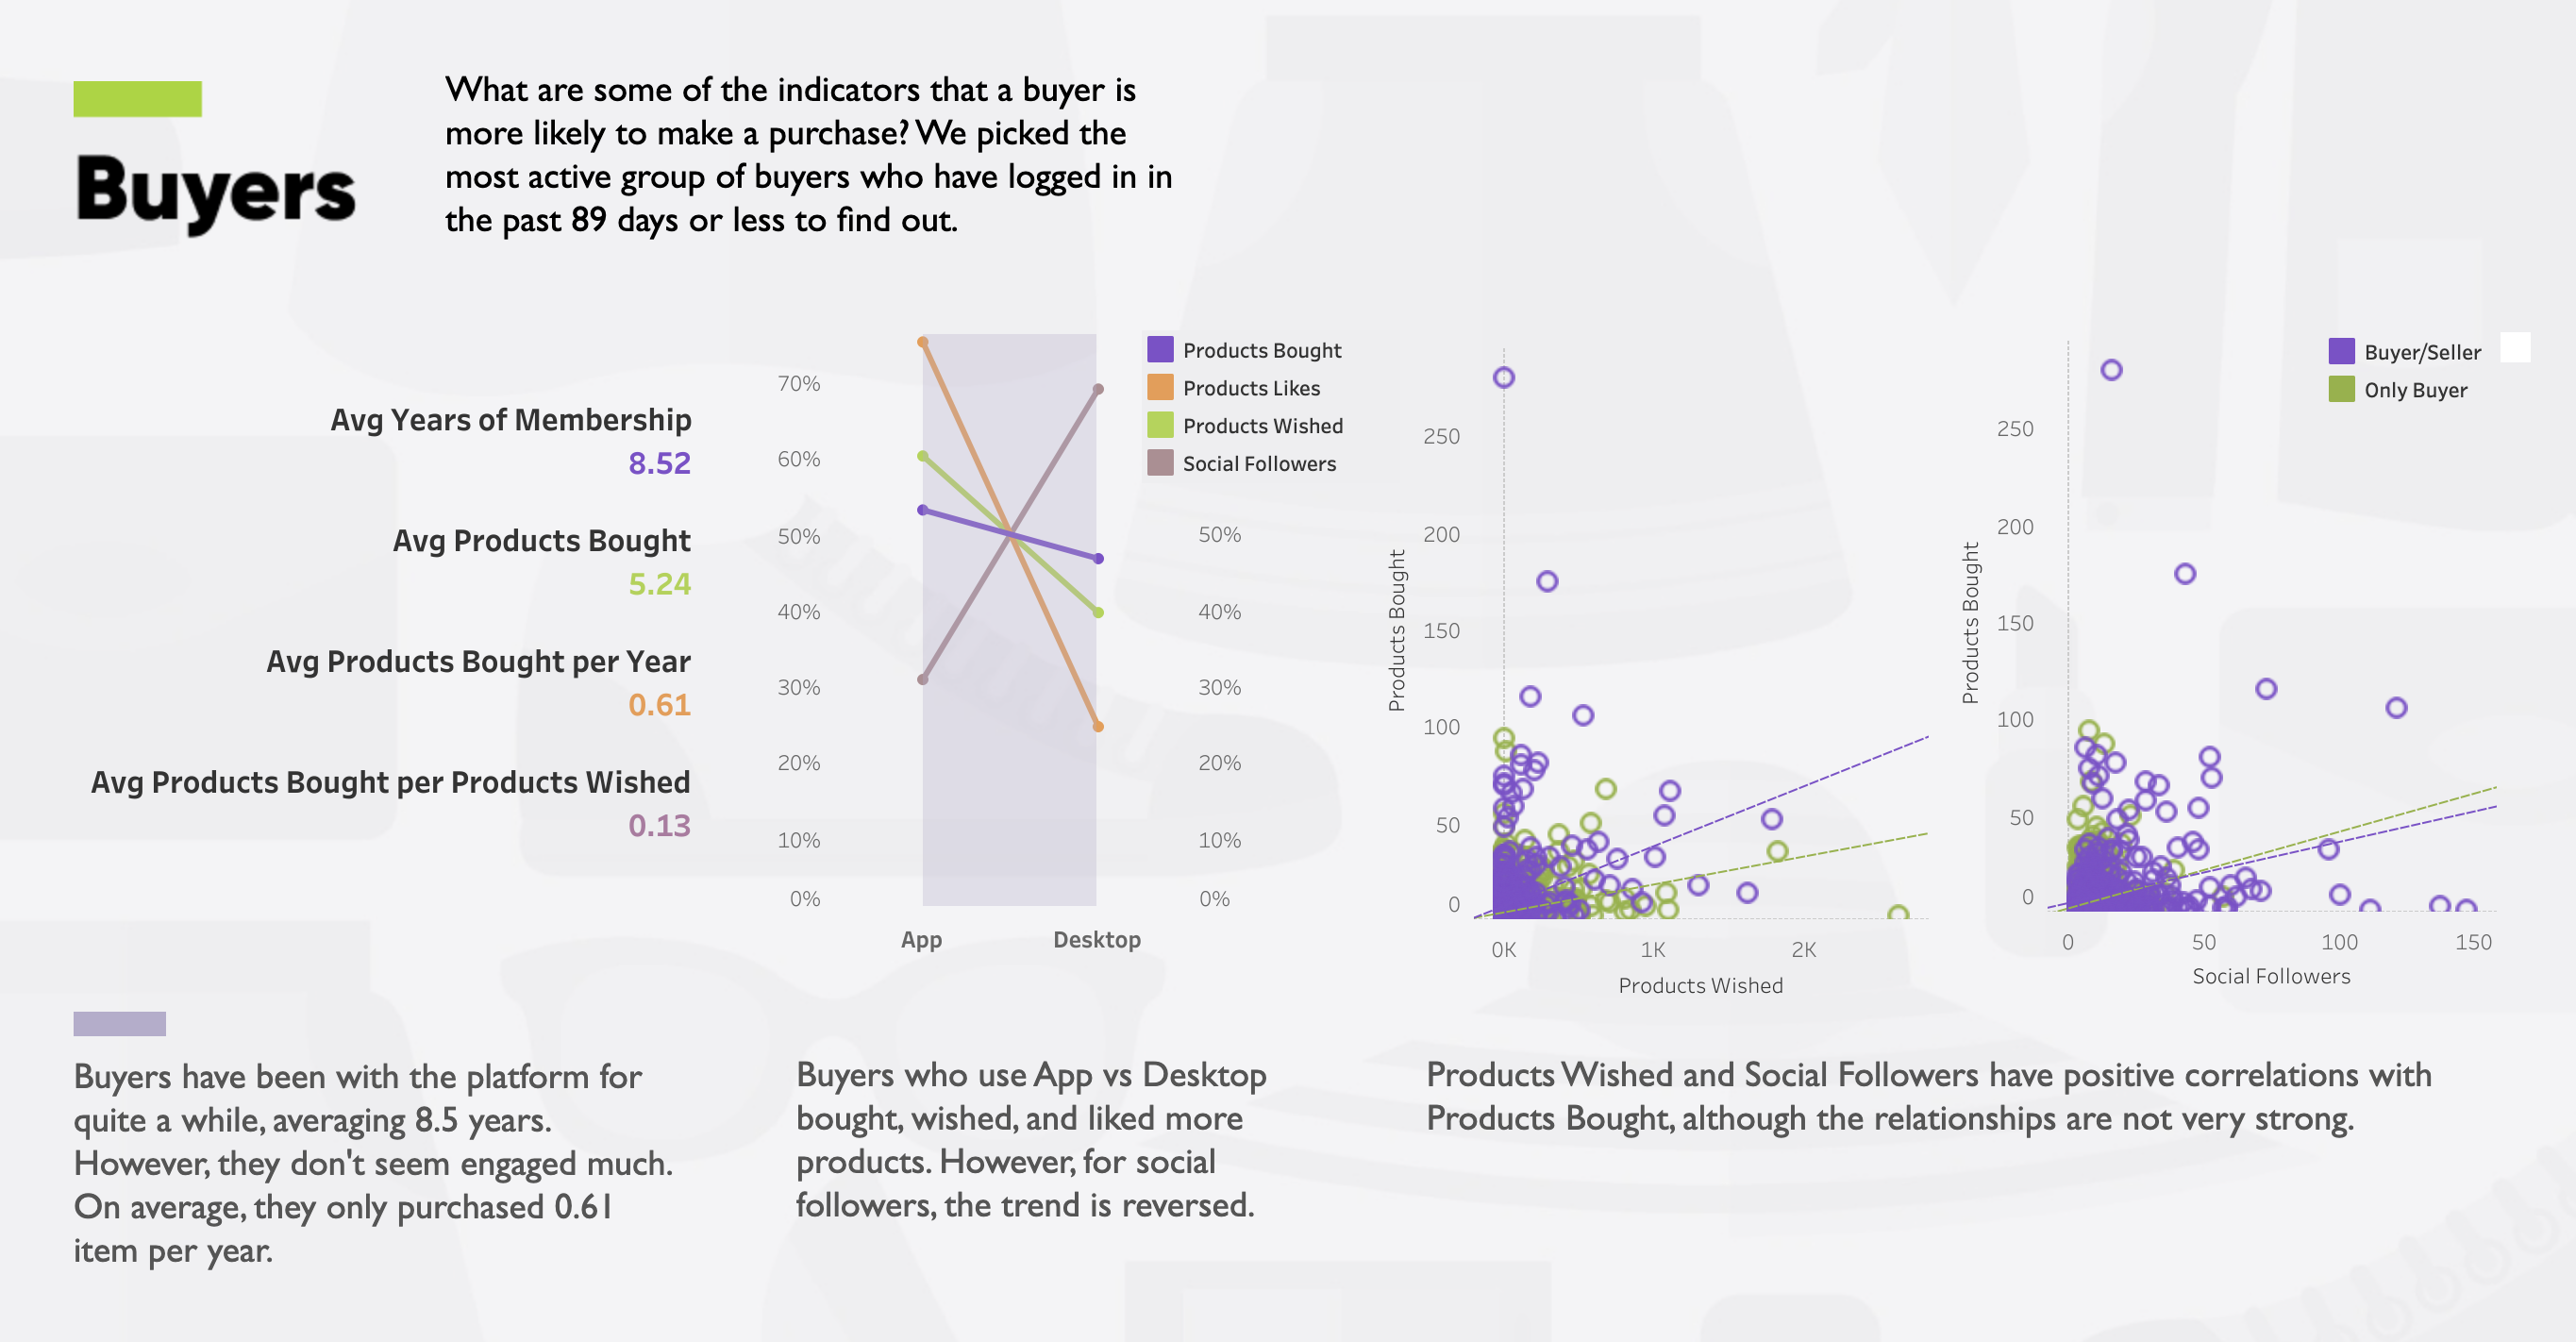
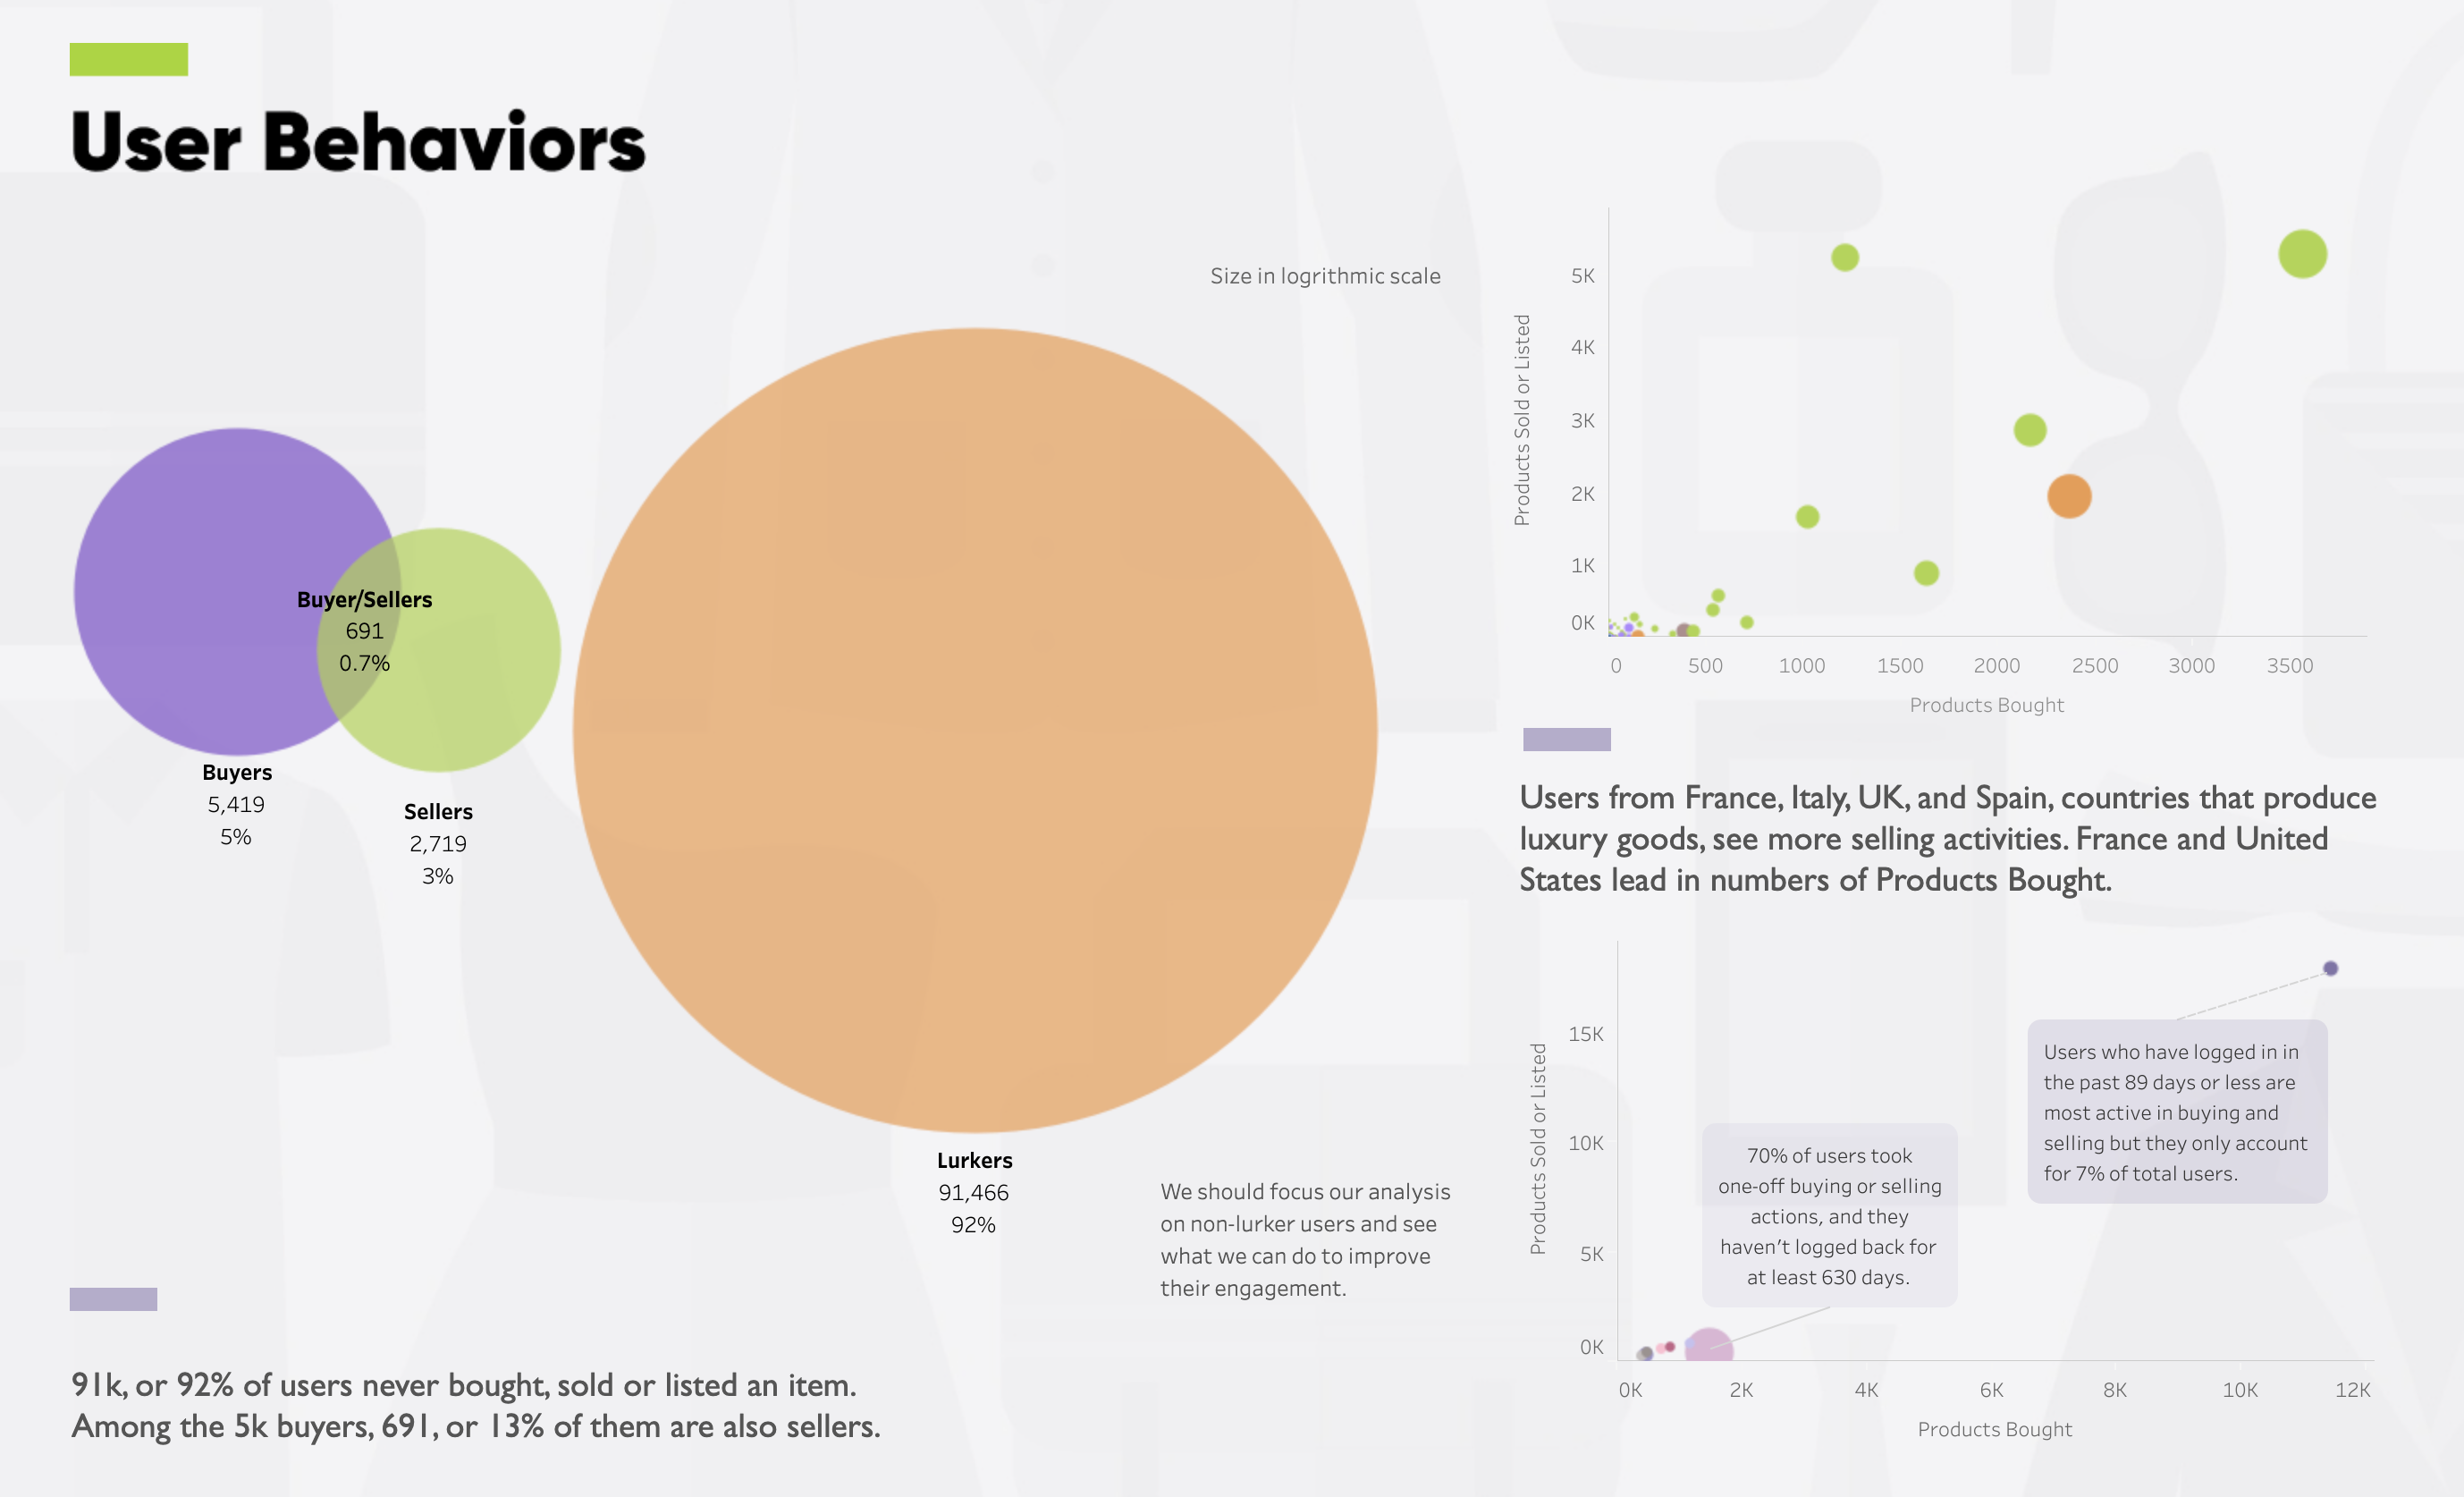
I then zoomed in on a subset of users who appeared more active. I found that for buyers, functions such as Product Wishes and Social Follows contribute to greater sales.
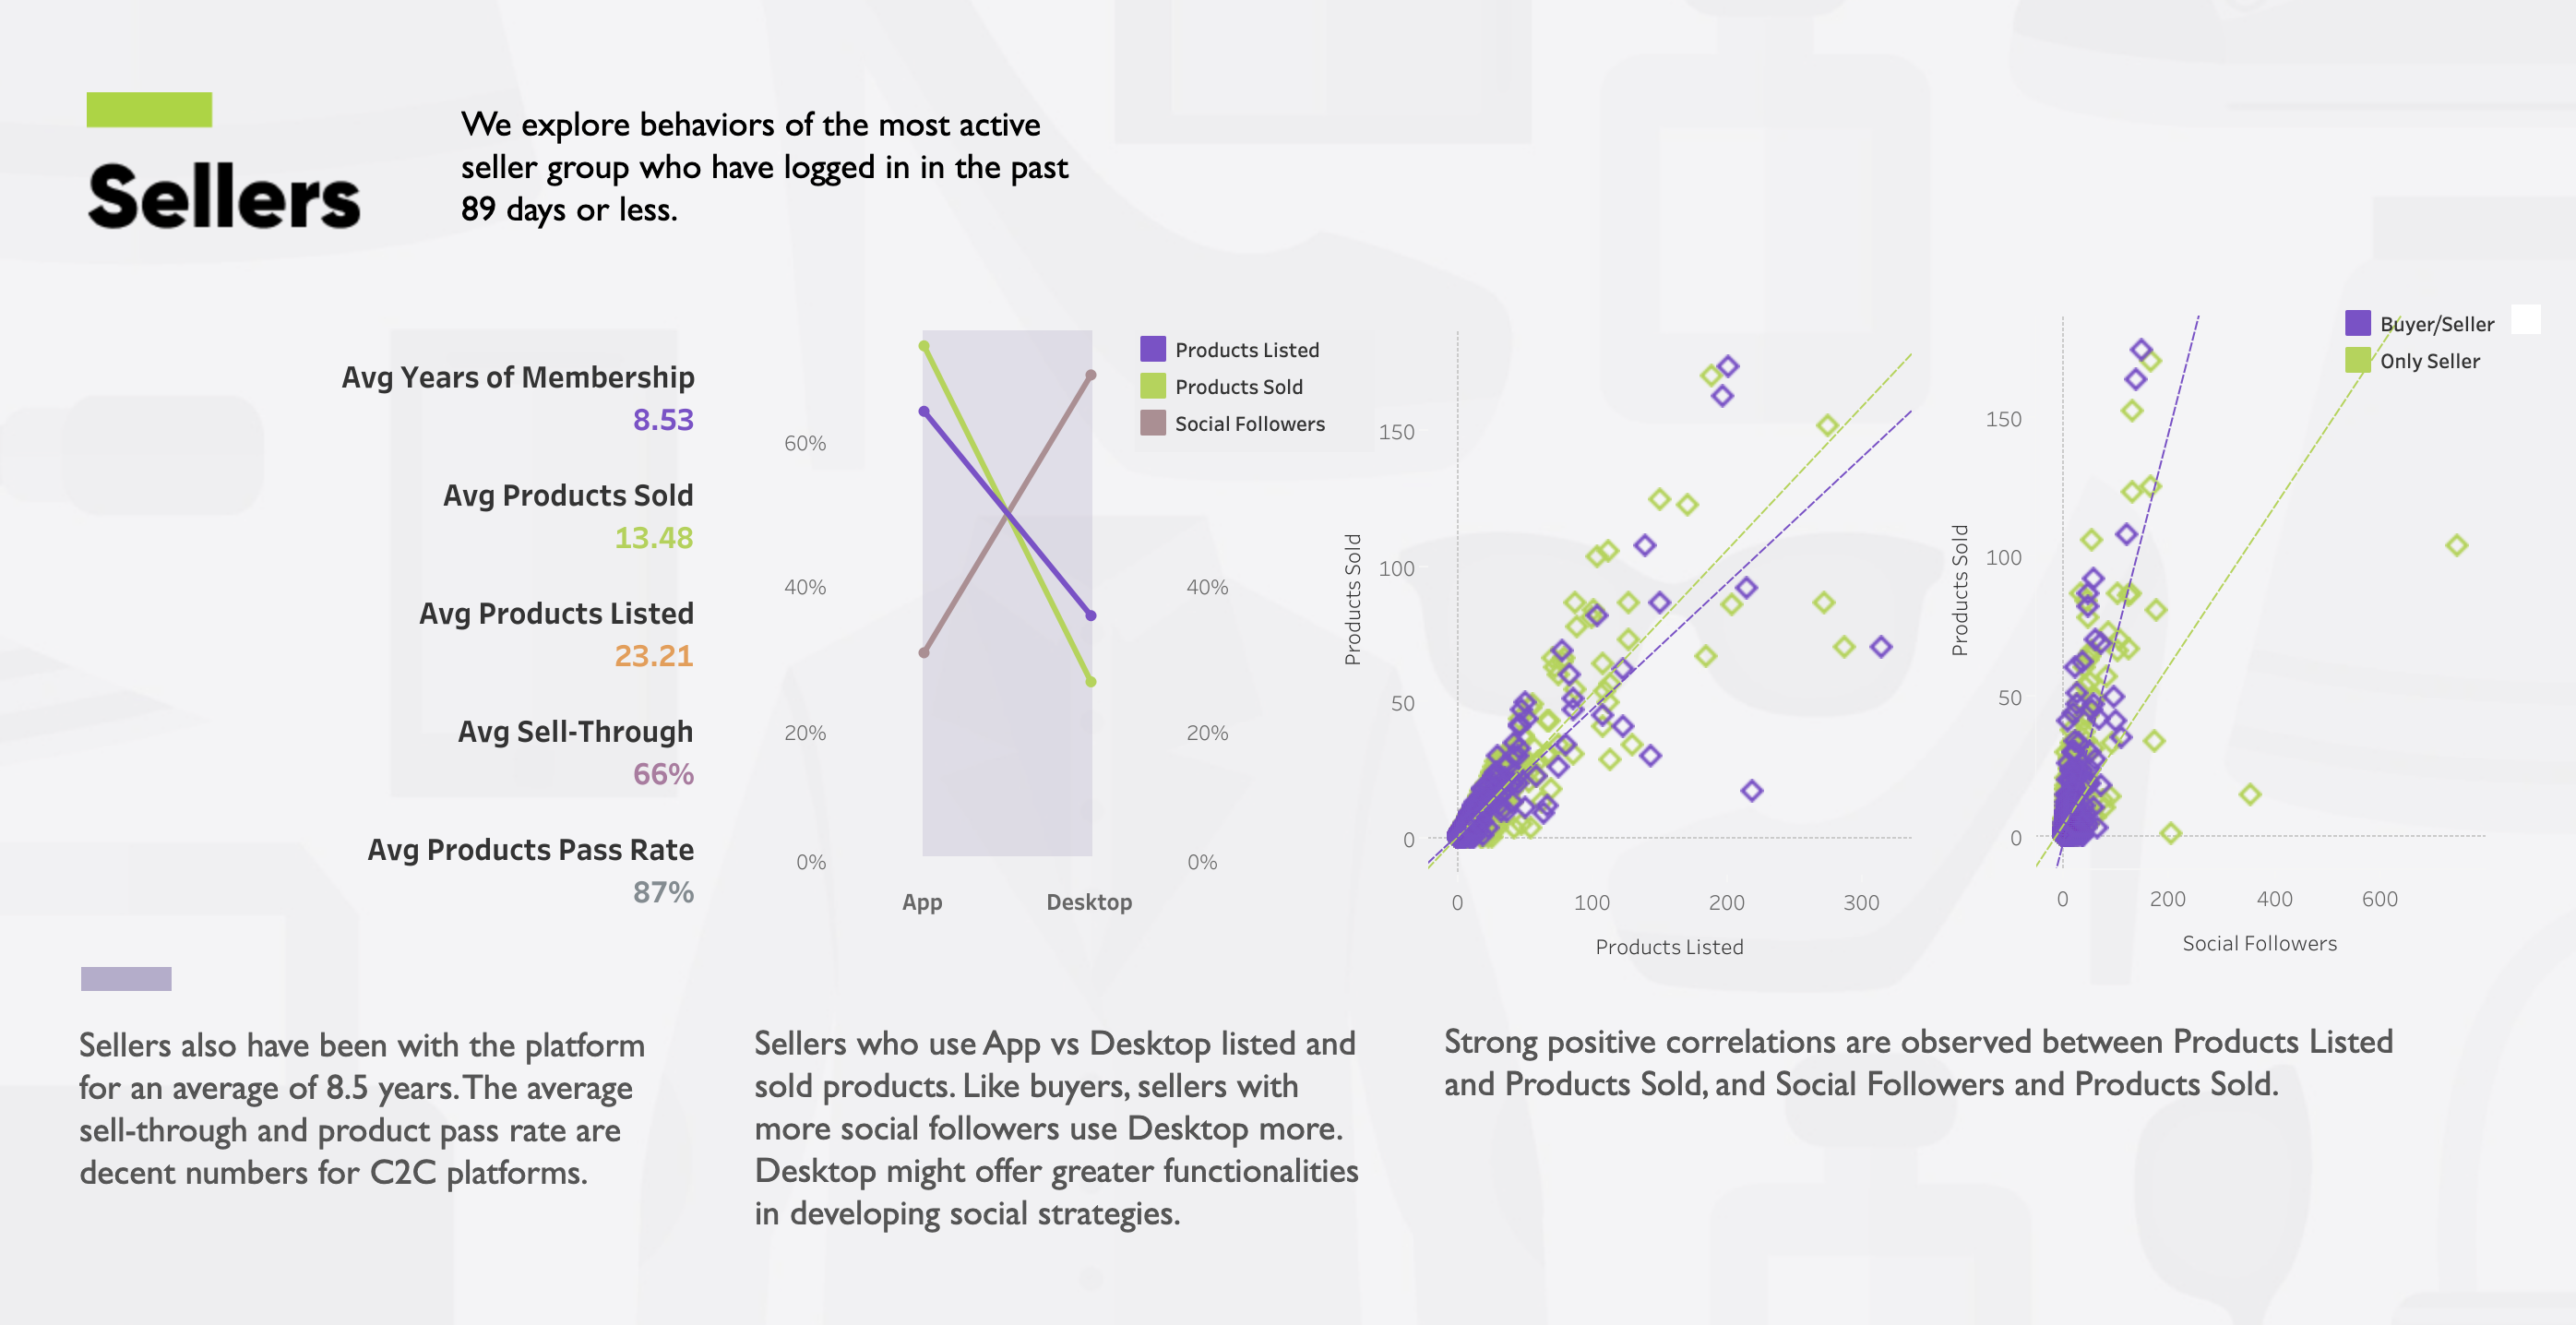
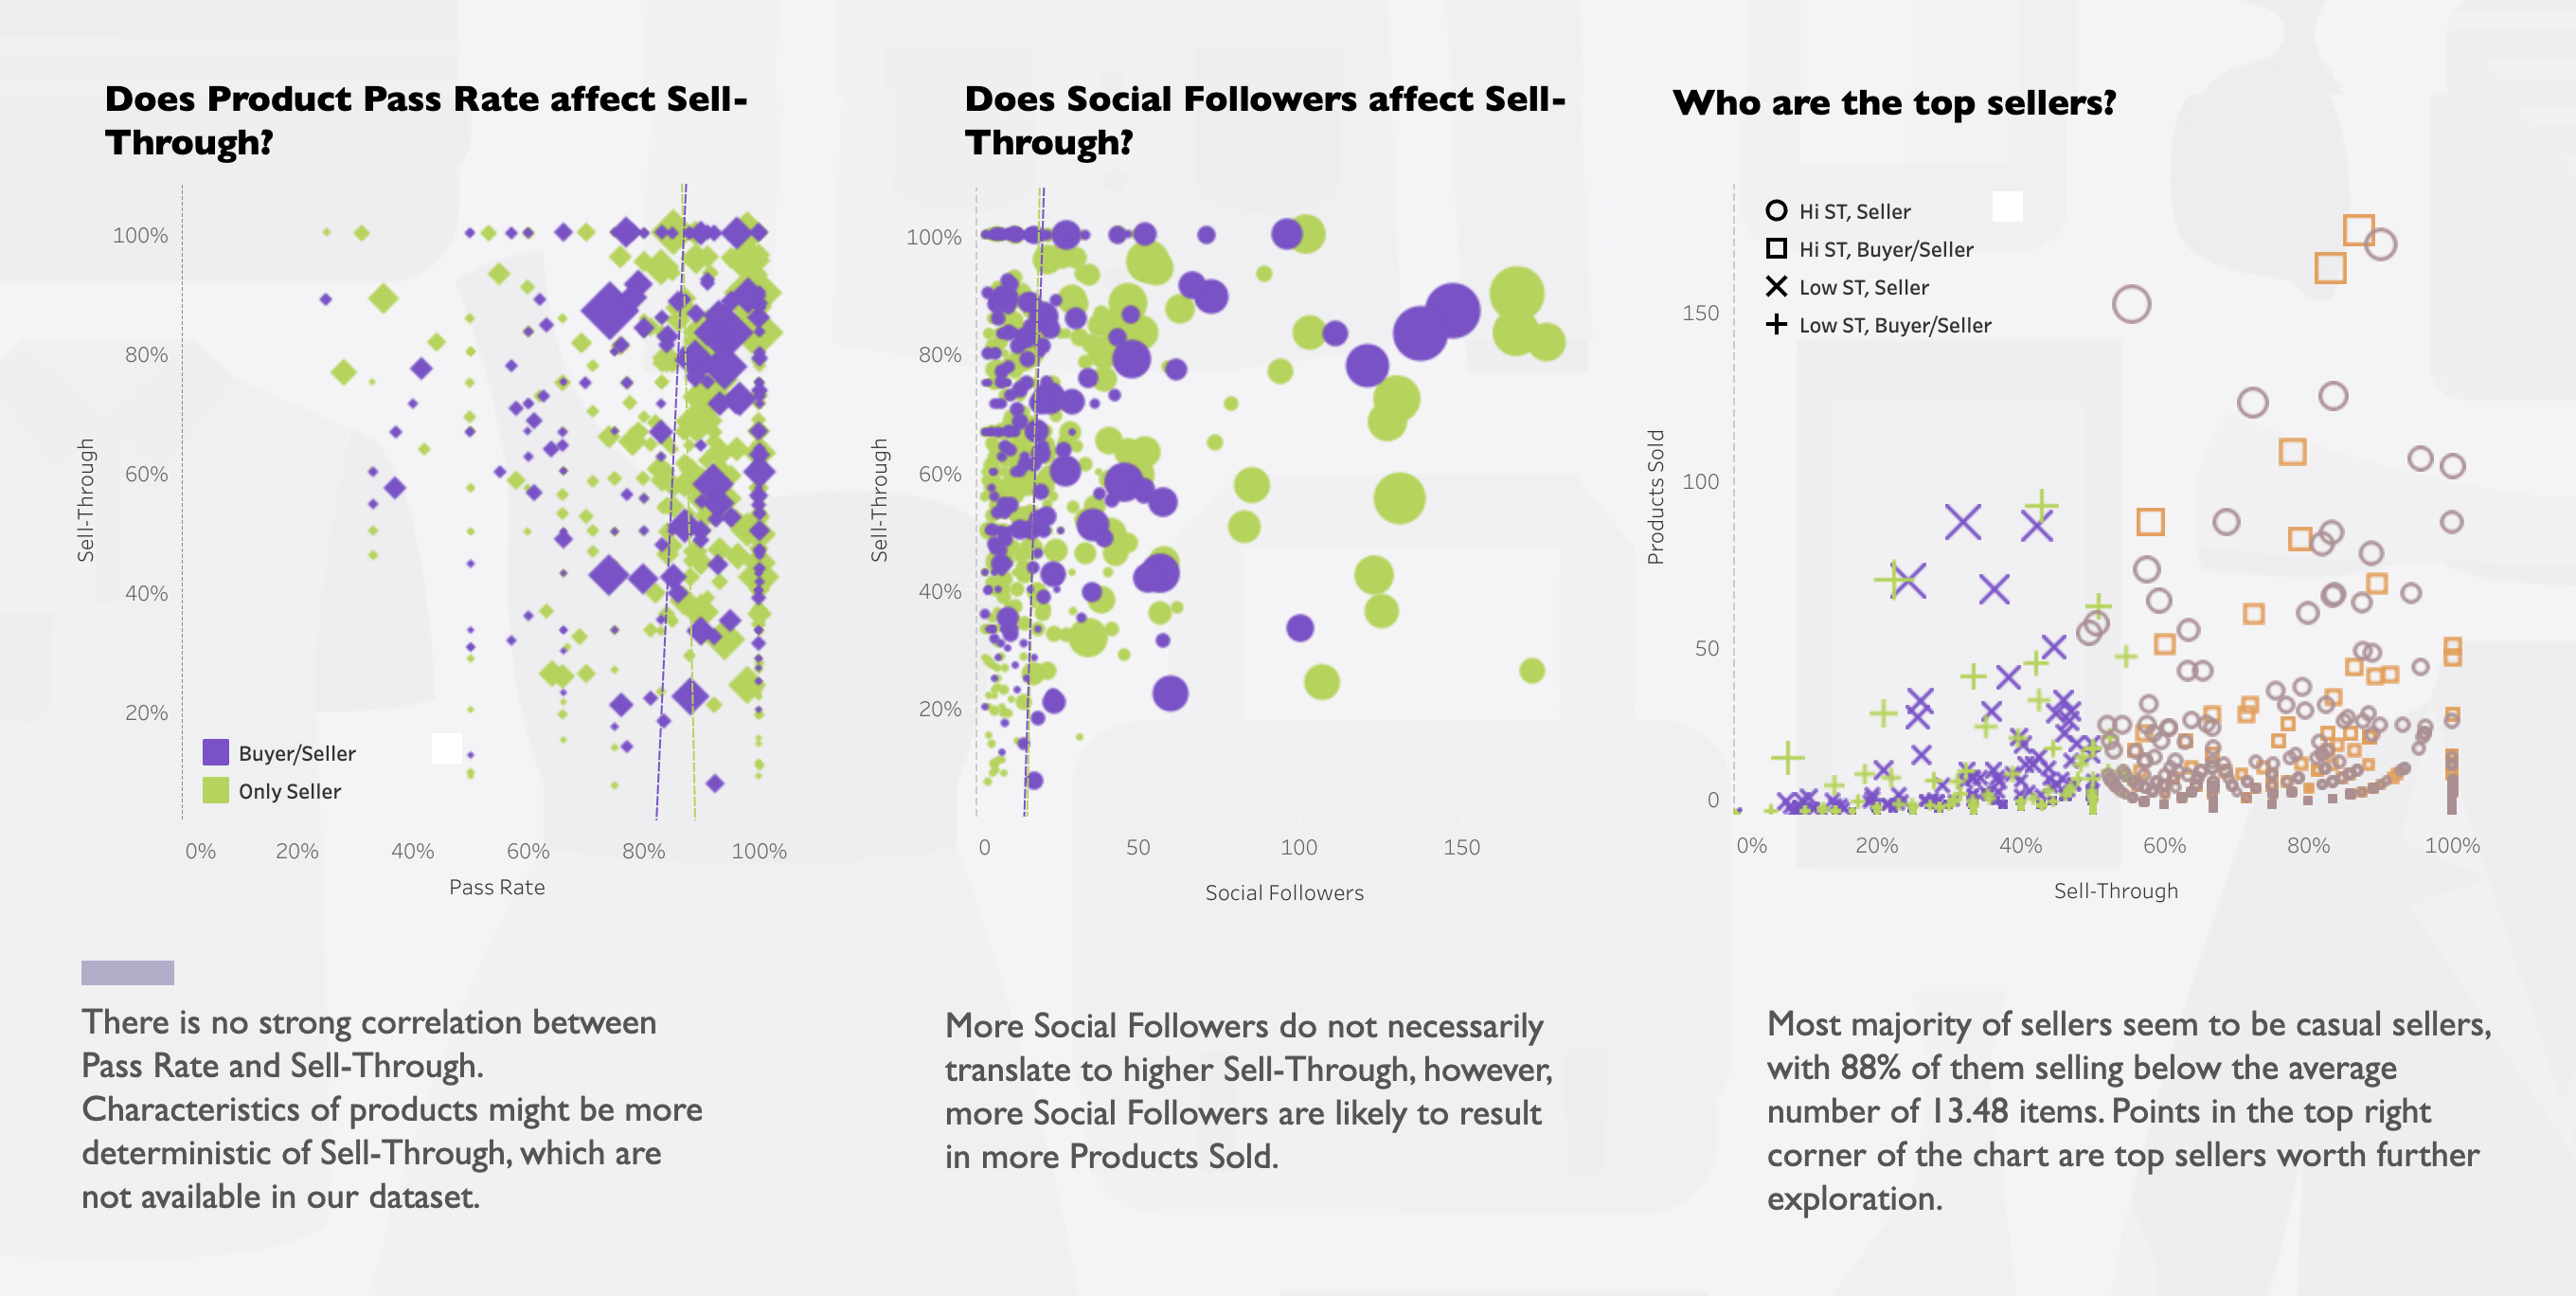
For sellers, it's worth noting that metrics such as Sell-Through and Pass Rate are relatively healthy by resale business standard. Social Follows and Product Listings are correlated with greater sales, however, they don't influence Sell-Through very much.
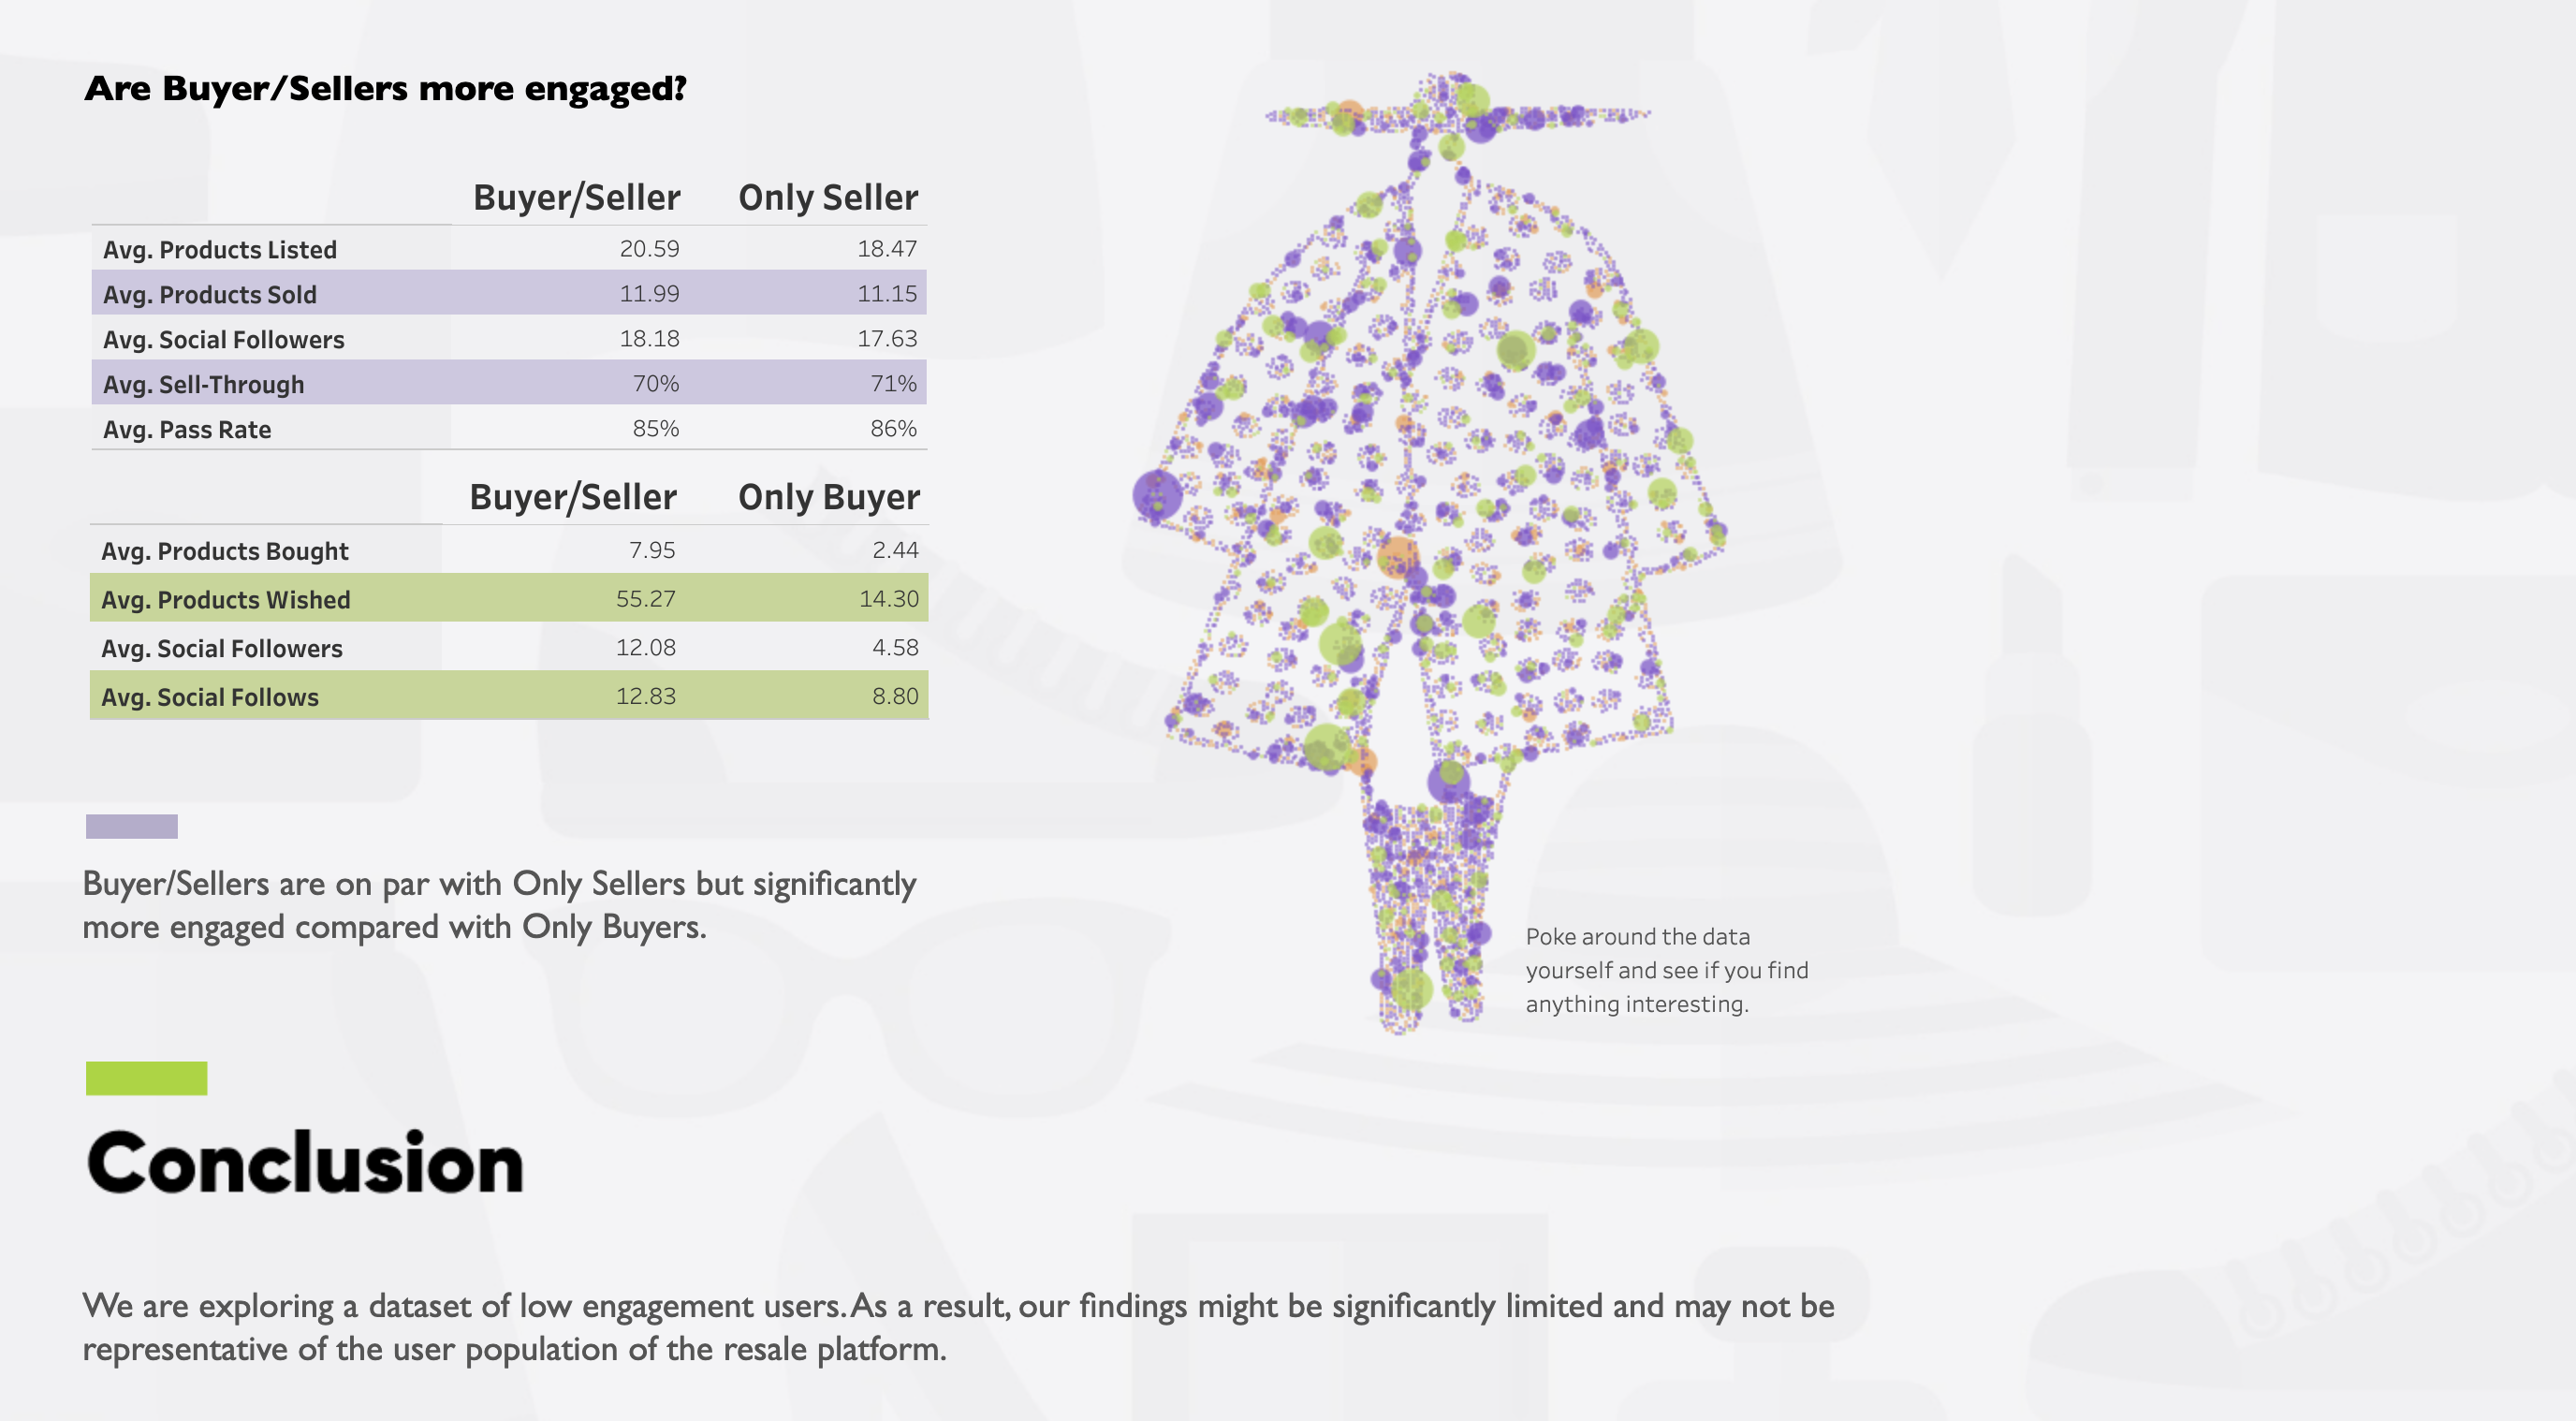
Finally, I looked into potential cross pollination between Buyers and Sellers and found that in terms of engagement, Buyer/Sellers are on par with Only Sellers, but much more active compared with Only Buyers.
Fashion Resale User Analysis
Data Storytelling
In this data story, I took a deeper dive into user engagement data of a C2C fashion resale platform and saught to identify relationships of key resale metrics such as Sales, Listings, Wished, Social Follows, Sell-Through, and Pass Rate.
Charts I built:
- Circle Dot Chart
- Treemap
- Area Chart
- Scatter Plot
- Slope Chart
- Image Dot Chart