The content of this Tableau dashboard is NSFW.

This is a fun data story project I built for the #IronViz2021 competition as part of my Tableau learning journey. It features a deep dive into 240k Pornhub videos and surfaces granular and aggregated insights leveraging Pornhub’s taxonomy and tags. I came across this dataset on Reddit and it piqued my interest because I think human sexuality is often discussed but rarely analyzed in public not to mention visualized.
Joy Explicitly
Data Storytelling
I had fun creating many bespoke charts through this project and was blown away by some of the insights drawn from my analysis. To quote Maureen O'Connor, our collective sexual consciousness "is in a state of high-speed evolution".
Charts I built:
- Violin chart
- Donut scatterplot
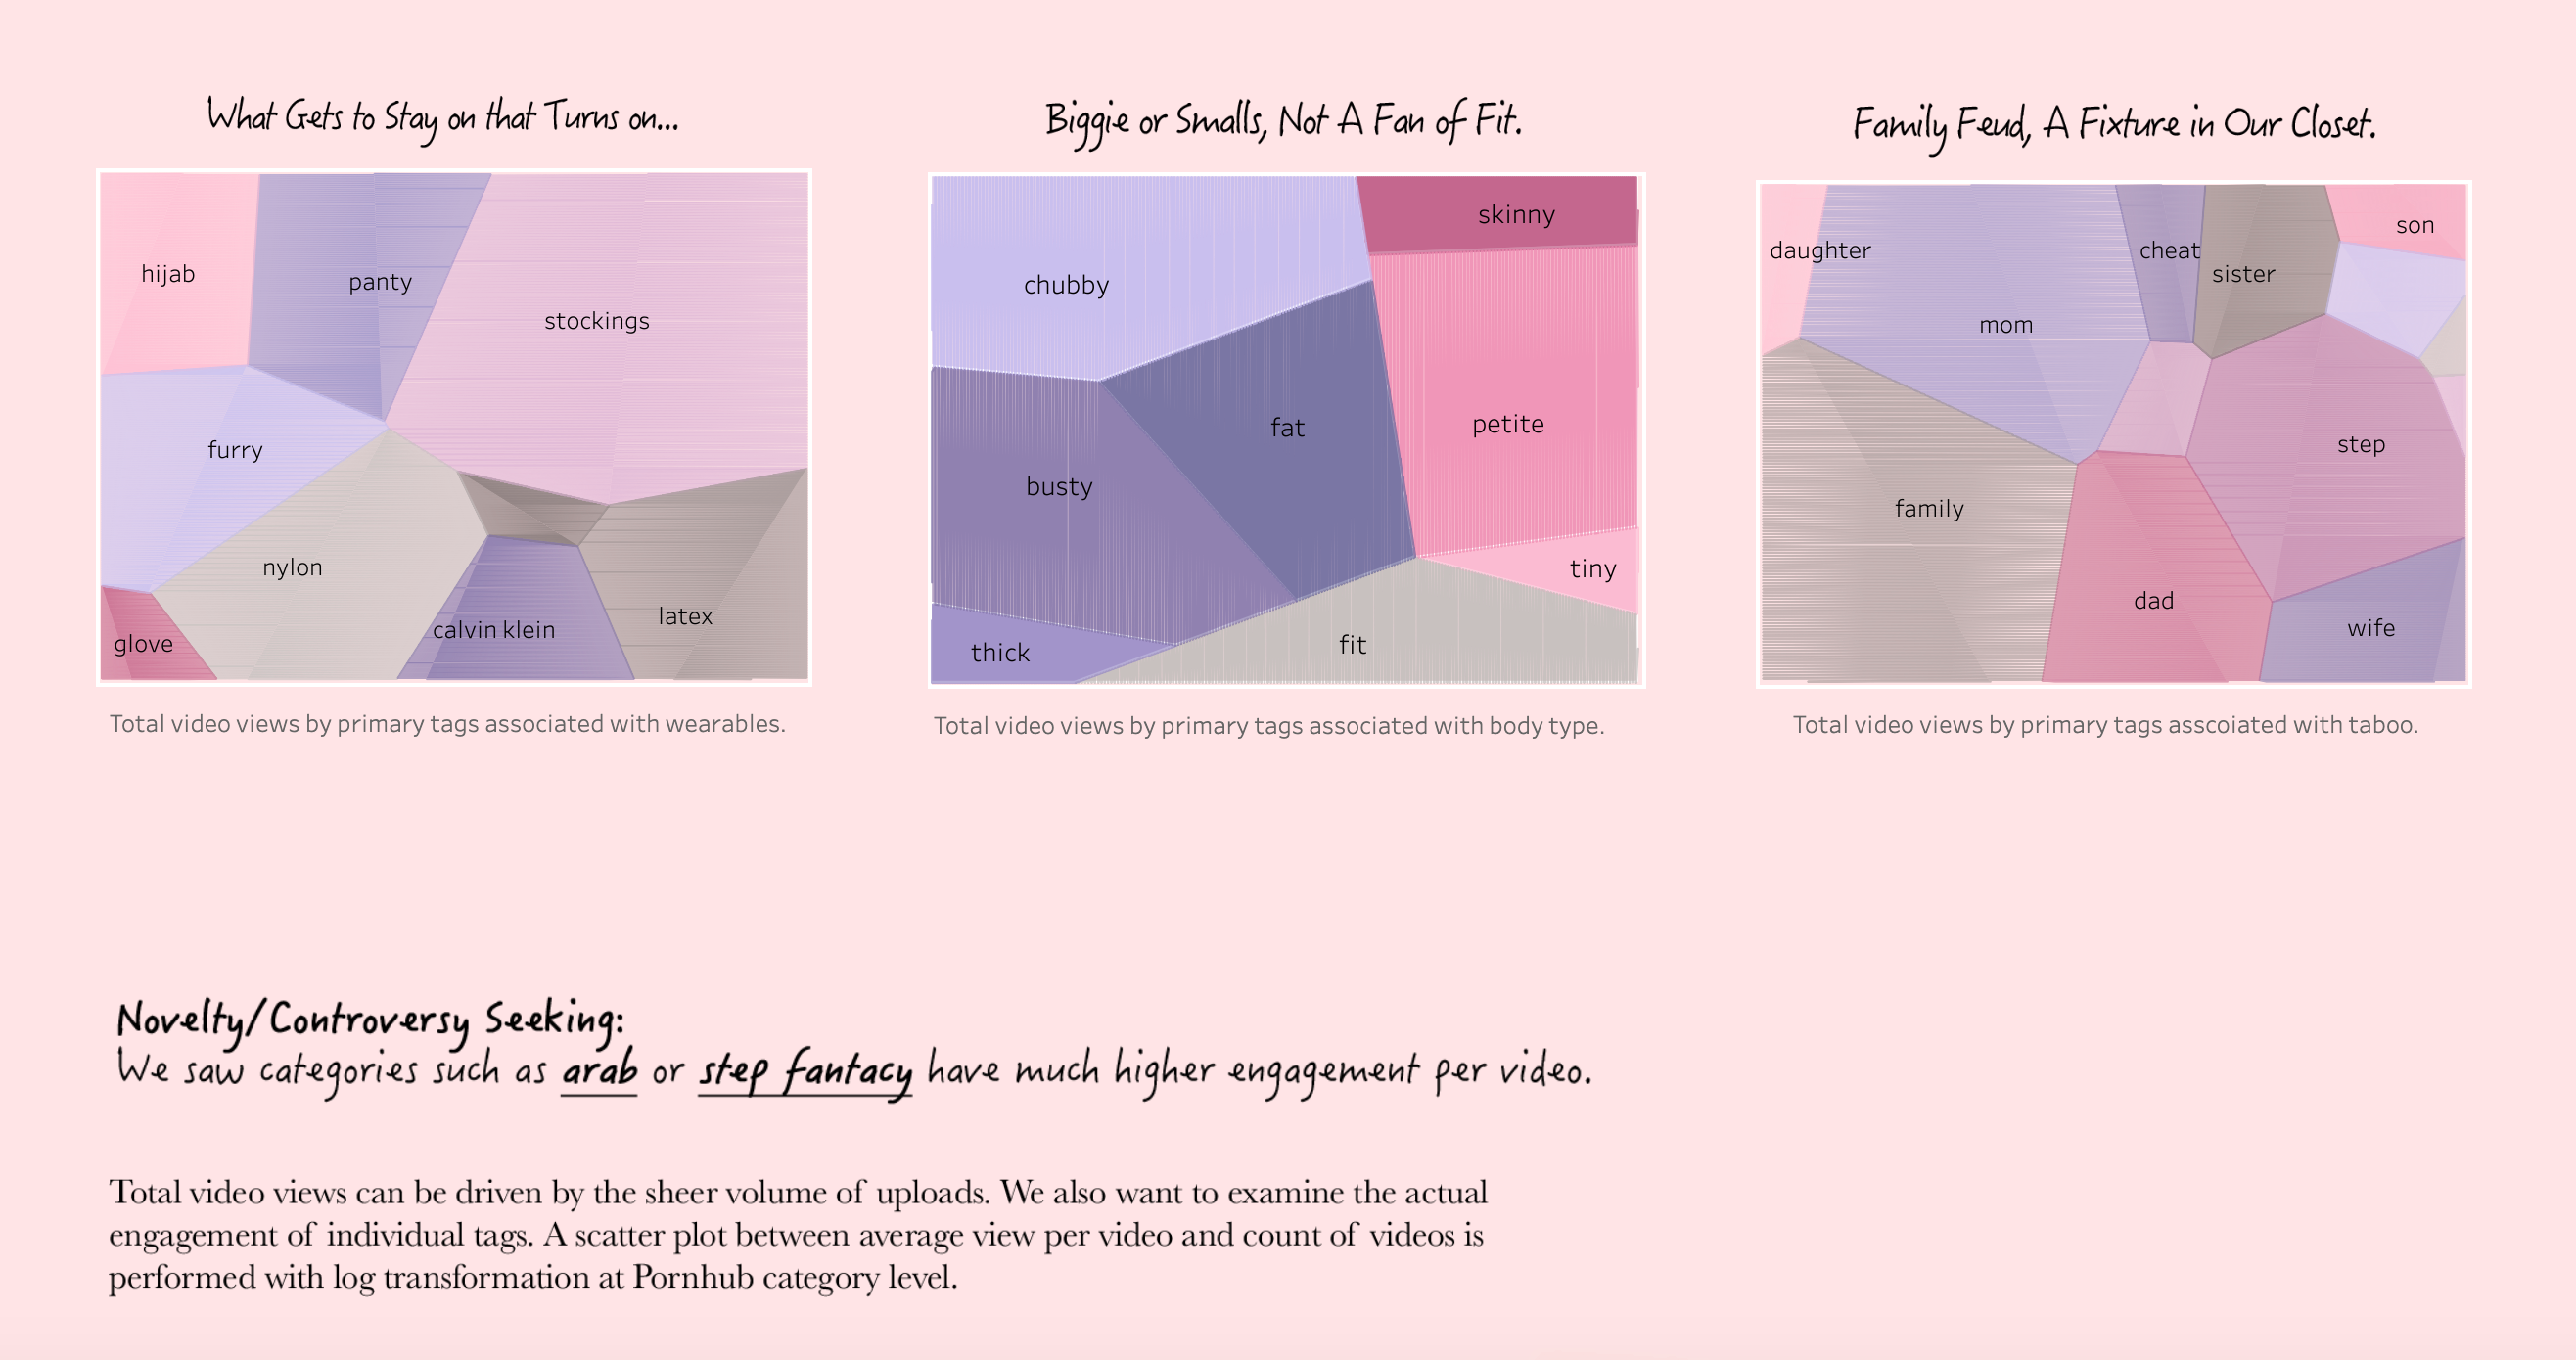
- Custom Voronoi chart