This is my qualitative project at the Major Studio 1 class during my study at the MS Data Visualization program at Parsons School of Design. The project is in collaboration with The Division for Sustainable Development Goals (DSDG) in the United Nations.
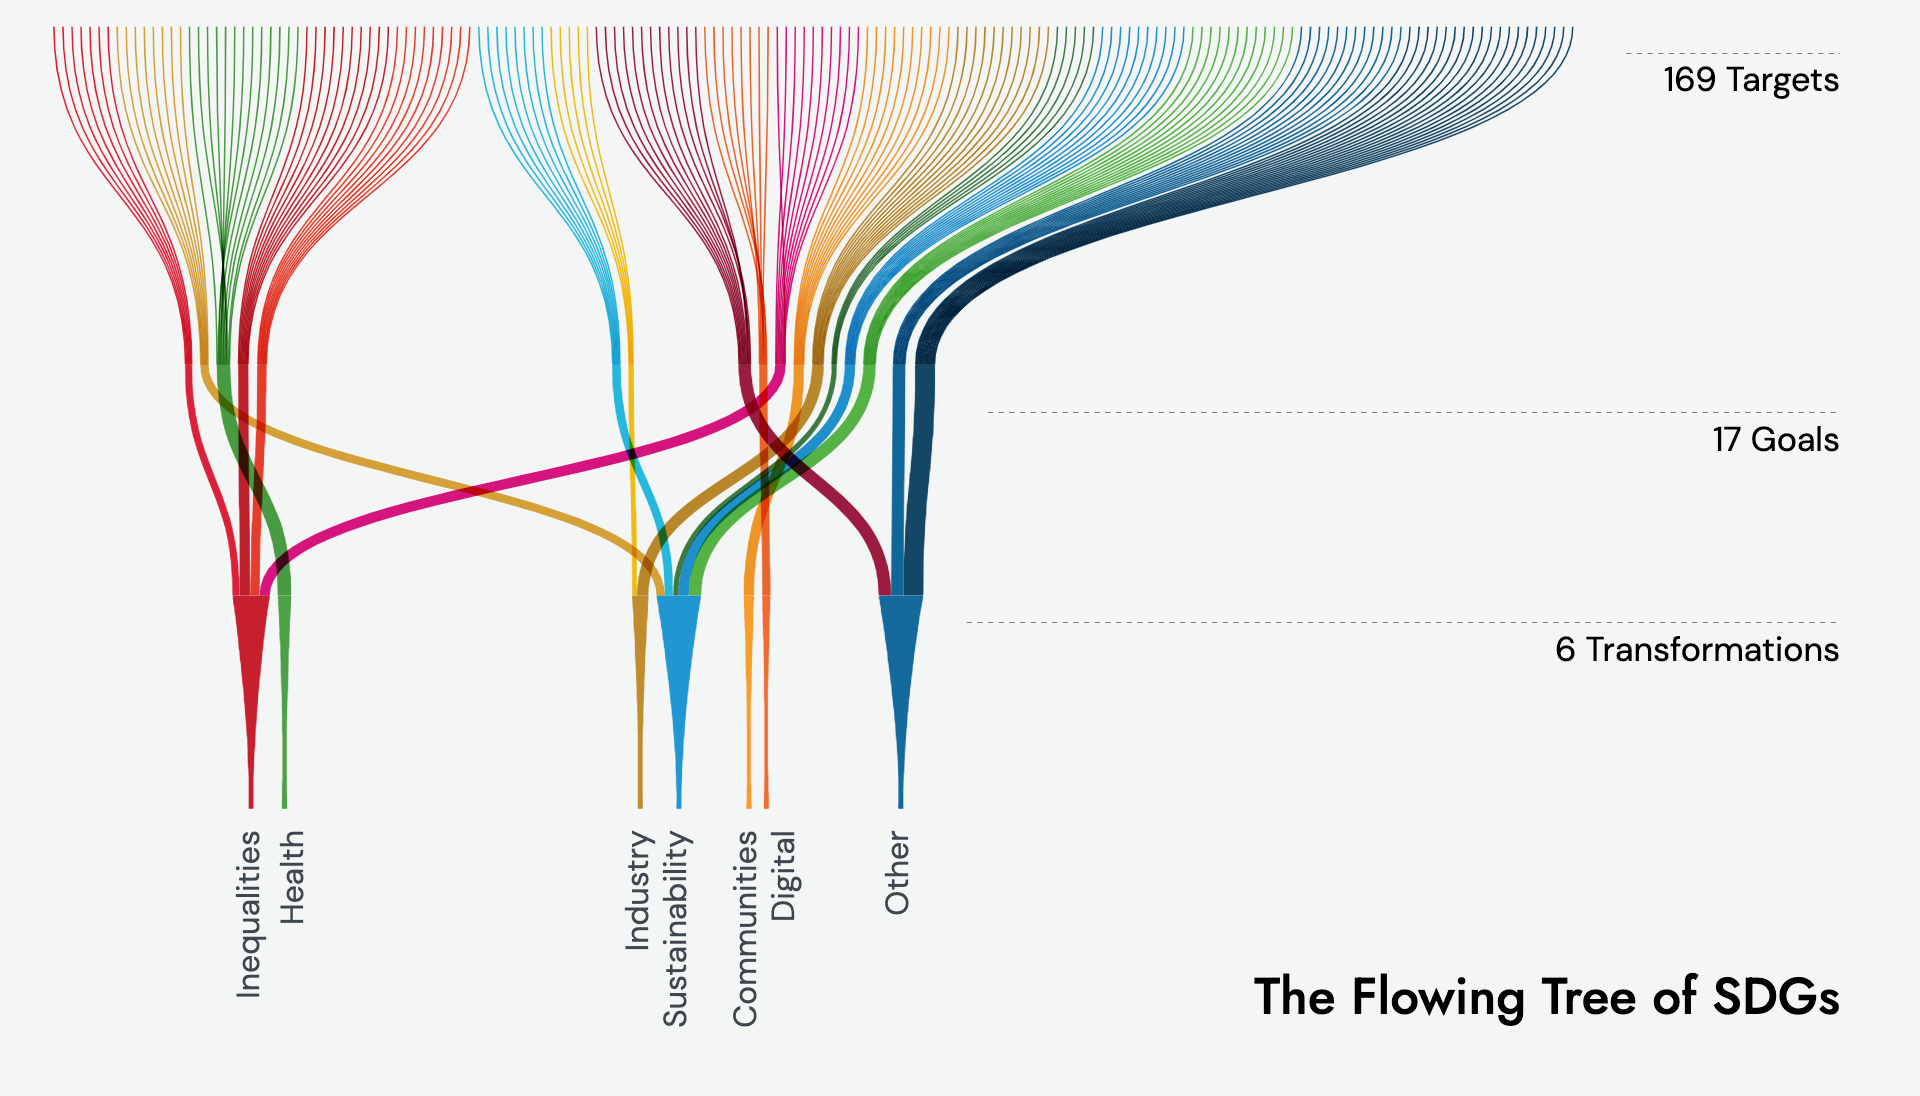
This experimental flowchart attempts to display the hierarchy of SDGs and connectivity between goals in an intuitive and organic format.
The Flowing Tree of SDGs
Data Visualization
I experimented with customizing a Sankey flowchart and a multi-point tooltip that display different paths of hierarchical data based on user selection.[Github Documentation]
Tools I used:
- d3.js
- HTML5/CSS