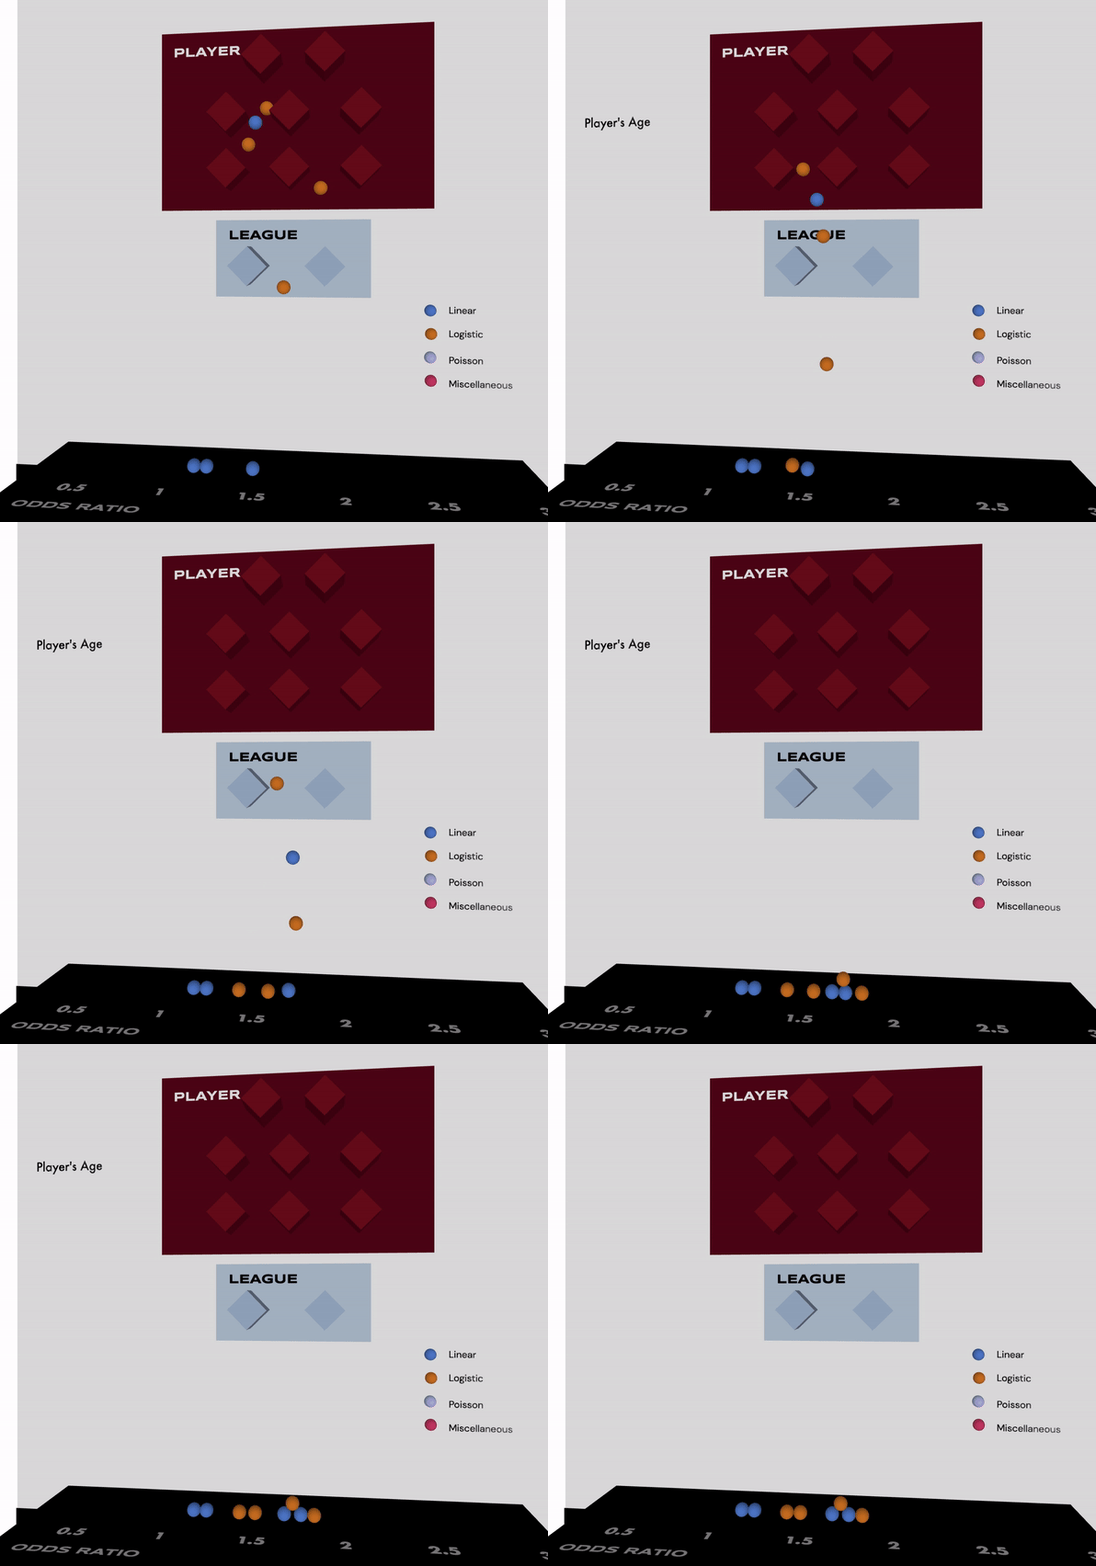
The psychological science community is undergoing a replication crisis where according to an experiment performed by Open Science Collaboration (OSC) in 2015, only 47 out of 100 published studies could be successfully replicated. While OSC’s replication methodology is debated, it is acknowledged that uncertainty is inevitable in analytical research, and can result from varying analytical methods of similar professional reliability and validity.
The project is based on a crowd-sourced research experiment conducted by Silberzahn & Uhlmann in 2015, during which 29 teams of data experts were tasked to analyze the same dataset about soccer players and attempt to answer the same question using an odds ratio metric – are darker skin-toned players more likely to receive red cards from referees?
29 teams produced 20 odds ratios ranging from 0.89 (more unlikely) to 1 (unlikely) and to 2.9 (more likely).
Visualizing Uncertainties in Analytical Research
Data Visualization
I used animation and 3D simulation to draw analogies between abstract concepts and naturally occurring phenomena and test comprehension of the following ideas.
- The uncertainty in the analytical result is manufactured randomness.
- Despite the uncertainty, crowd-sourced research can be used to validate findings.
- This visualization can facilitate intuitive comprehension and new knowledge production.
Tools I used:
- p5.js
- matter.js
- HTML5/CSS
- WebGL